FREE DOWNLOAD
Return on Customer Experience Model
Measure the impact of customer experience on your bottom line
Do you know how much money bad customer experience is costing your business?
The Return on Customer Experience model is a downloadable spreadsheet where you can input up to 8 key metrics and calculate the annual bottom line impact of improvements to your NPS.
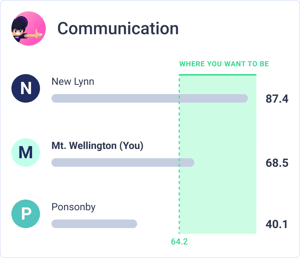
There is a direct correlation between NPS and key business outcomes for service businesses. Even for companies with an already high NPS there is still an average gap of 57 points between their highest and lowest performing locations.*
Ready to quantify how NPS impacts your referrals, repeat business, staff retention, and rework? Download the model.
*AskNicely benchmark study 2020
1%
7 point increase in NPS leads to 1% increase in revenue
(London school of economics)
4.2x
Promoters are 4.2x times more likely to make repeat purchases and/or refer friends.
(Temkin/XMi Research Study 2019)
57
Average gap between the lowest and highest performing locations is 57 points based on study of AskNicely customers.
(AskNicely Benchmark Study 2020)

Want the most accurate results? Talk to one of our experts
We’ve got years of experience helping service businesses like yours improve their customer experience AND connect better CX to revenue growth.
We developed this “Return on Customer Experience” model for our clients to use based upon real data from financial growth they've experienced after implementing AskNicely's CX platform.
If you want help getting the most accurate results from the model we're happy to help!